Cody Le //

Data Centric Creative Problem Solver // Learner, Evaluative Thinker, Technologist, Cold Coffee Brewer
Data Scientist. // Jarvis College of Computing & Digital Media, DePaul University alumnus. // M.S. in Data Science with Distinction. // AI applications for Health and Scientific Research.
Portfolio
Machine Learning //
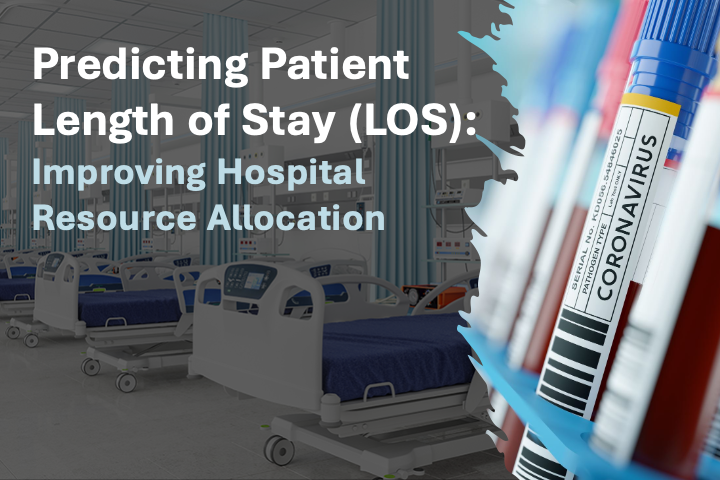
Predicting Patient Length of Stay (LOS): Optimizating Classification Models for Multi-class Target Variable
Analyzed For: DPU CDM | Type: Academic | Contribution: Individual
Platform: Python | Data Source: Kaggle-Analytics Vidhya Healthcare Analytics
Analysis explores ensemble learning optimization techniques to optimize classification models for predicting a multi-class categorical target using various hospital related predictor features without patient demographics except patients’ age range. Extensive data preprocessing was explored including data encoding, outlier removal, and feature transformations to off set data imbalance. Tree, boosting, and histogram models were most effective for classification and optimized models using multi-class ensembles and voting ensembles were implemented.
Automotive and Semiconductor Supply Chain Analysis:
Mitigating COVID-19 Disruptions in U.S. and S.Korea
Analyzed For: DPU DSKUS | Type: Academic | Contribution: Team Lead
Platform: Python | Data Source: Various Datasets from Government Agencies
Investigated the impact of COVID-19 pandemic on the supply chain by examining trade, production, and manufacturing capacity of the automotive and semiconductor industries in the United States and South Korea. Collected and merged existing data between the two industries from various government sources from the two countries. Feature selection was performed to identify salient COVID-19 features that affect trade, production, and manufacturing which was then used to build a forecasting model using Gated Recurrent Unit (GRU) to predict future response to target variables under the change of feature selected variables.

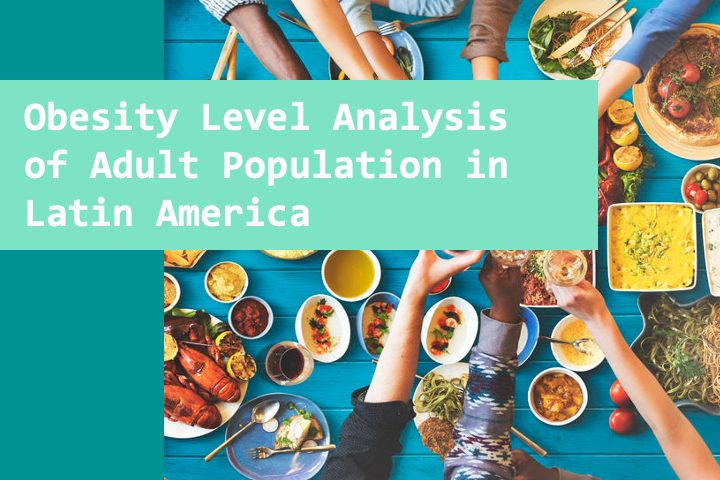
Obesity Level Analysis of Adult Population in Latin America
Analyzed For: DPU CDM | Type: Academic | Contribution: Team Lead
Platform: Python | Data Source: UCI Machine Learning Repository
Cluster analysis was used for data exploration and classification as well as feature selection for analysis of obesity levels among adults from Mexico, Peru, and Columbia to determine which specific eating habits or daily activities most predict obesity levels.
Analytics and Visualization //
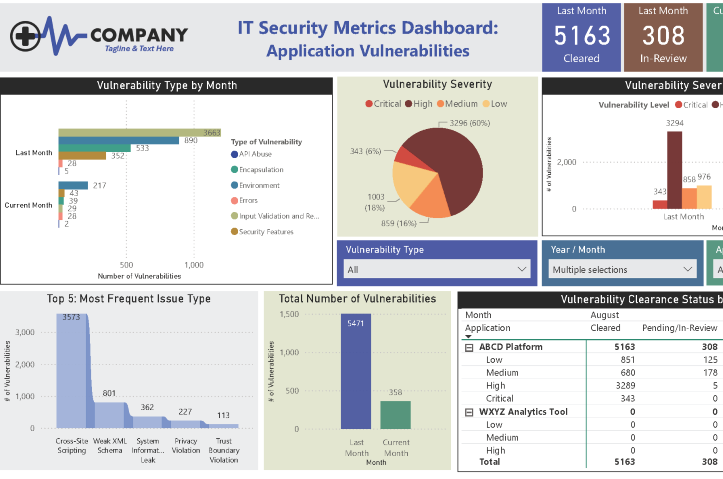
Dashboard: IT Security Metrics - Application Vulnerabiltiies
Developed For: CDC NCEH/ATSDR | Type: Professional | Contribution: Individual
Platform: PowerBI | Data Source: Log-style data from app security platform
Orcheastration: Data ingested by API using Power Automate to SQL Database
Stakeholders: IT Security Officers | End-Users: Leadership/Managers
This dashboard provides KPIs such as risk accessment and vulnerability severity through month-over-month analytics focused on remediation efforts. It provides a monthly snapshot and summary of these efforts to leadership to better understand their applications current security weaknesses, progress of remediation, and most frequent type of risks. This dashboard is critical in supporting IT security managers with assessment, prioritization, remediation, and validation of the the clearance process in protecting sensitive data, meeting compliance requirements, and reducing cybersecurity risks in their deployed applications.
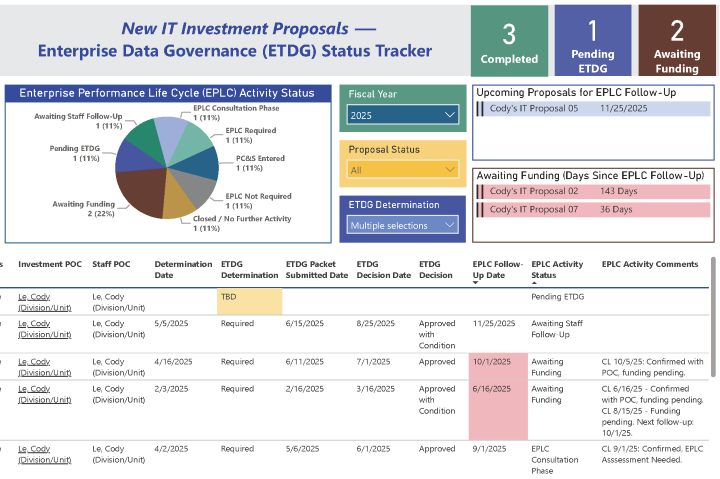
Dashboard: Data Governance - Tracking New IT Investments
Developed For: CDC NCEH/ATSDR | Type: Professional | Contribution: Individual
Platform: PowerBI | Data Source: SharePoint Lists
Orcheastration: Developed Customizd SharePoint Tracker for Stakeholders
Stakeholders: IT Governance Staff | End-Users: Leadership/Managers
This dashboard provides monitoring and review of new IT investments through the IT governance process focusing on follow-up efforts with investment stakeholders and funding allocation timelines. Custom visuals in this dashboard include real-time notification displays that provide notification to end users of upcomiong dates as well as alerting staff of time lapse after expected dates. This dashboard is paired with a SharePoint tracker allowing staff to easily track and monitor key activities for new investments. This dashboard is critical to improve transparency, compliance, and determine enterpise performance lifecycle requirements for new investments.
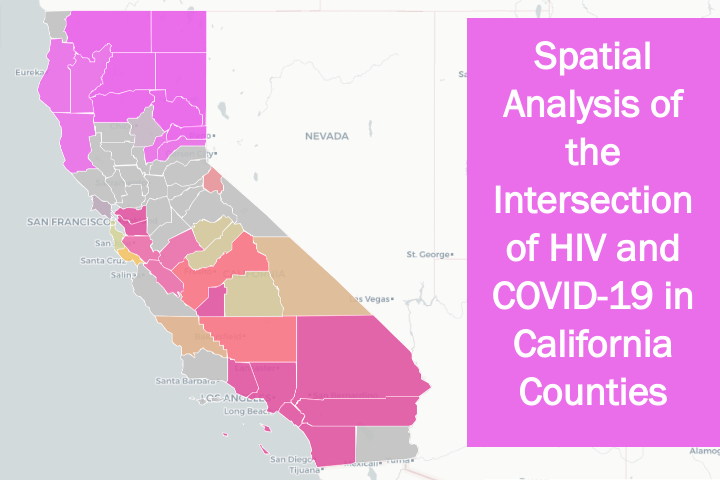
Spatial Analysis of the Intersection of HIV and COVID-19 in California
Visualized For: DPU CDM | Type: Academic | Contribution: Individual
Platform: Python | Data Source: Datasets from AIDsVu, CDPH, & CDC SVI
Analysis explores the spatial relationship between the HIV and COVID-19 in California at the county level. Analyzing new infection rates between the two epidemics and its impact on ethnic and minority groups is the focus. Through spatial clustering and outlier detection techniques, specific areas in California were determined to be more vulnerable to HIV and/or COVID-19. LISA interactive map was created to show significant clusters affected by both infection rates and social vulnerabilities. Agglomerative clustering was performed showing areas affected by higher social vlunerability related to ethnic and minority status.